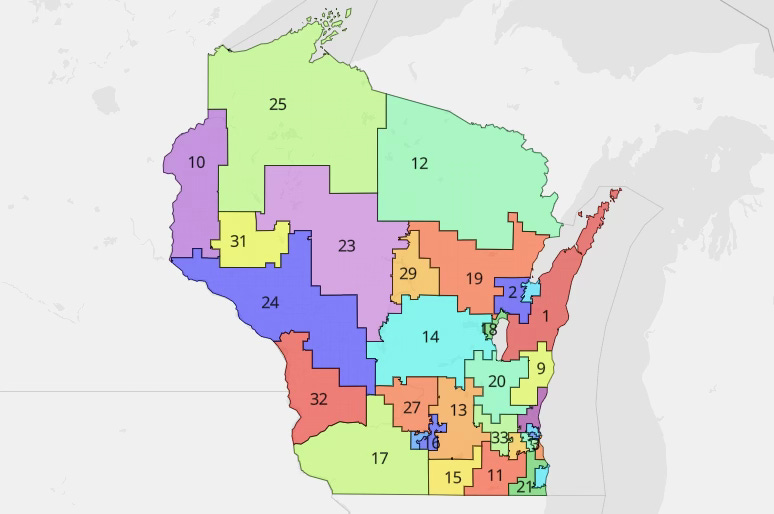
A new State Senate map, as submitted by ‘Clarke’ plaintiffs, led by Law Forward. Screenshot from Dave’s Redistricting App.
The deadline for new state legislative maps to be submitted to the Wisconsin Supreme Court is 5 p.m. on Friday, Jan. 12.
Hey, that’s today!
Several of the submissions have now been made public, including maps from the plaintiffs in the case, represented by Law Forward, Stafford Rosenbaum, the Election Law Clinic at Harvard Law School, Campaign Legal Center, and Arnold & Porter. You can see those submissions on Dave’s Redistricting App (DRA) here (Senate, Assembly).
Senate Democrats have also submitted maps and posted them on DRA. You can see those maps here (Senate, Assembly).
Gov. Tony Evers has also submitted maps and posted them on DRA. You can see those maps here (Senate, Assembly).
We know our readers here at The Recombobulation Area are very interested in redistricting and these maps, so please, share your thoughts, insights, and any additional information in the comments below in this thread.
Everyone should be following John Johnson from Marquette University, who has already laid the groundwork for some terrific analysis of the various maps submissions.
So we’re going to have seven total submissions to look through, per the MJS.
From “ Democratic Gov. Tony Evers, Republican legislative leaders, Democratic lawmakers, University of Wisconsin-Milwaukee professors, the conservative Wisconsin Institute for Law & Liberty and the petitioners who brought the lawsuit who are represented by Law Forward, a liberal legal firm.”
The Democratic proposals are probably good on partisanship (if not a little too good) and are horrible on just about everything else. The districts are not compact and have minimal care for municipal or county boundaries. Most people who aren't partisan Dems, if they see the proposed maps, won't see them as good and instead see a map that Dem politicians drew for their own benefit
One thing that's disappointing about the Clarke and Evers maps is they didn't change the VRA districts in Milwaukee, keeping the same districts that the GOP passed 2 years ago. While not terrible, the GOP did relegate one Black district to an opportunity seat (which was won by Darrin Madison, who is Black)
I sort of get it though. The Evers proposal was originally struck down for VRA reasons (when they expanded to 8 Black districts, but made each only barely majority Black). Keeping the same districts means SCOTUS can't use them as a reason to overturn the maps (since they were fine with them before)
Overall, I think my favorite is the Evers proposal, which balances well the desires for fair partisanship, compact districts, and municipal integrity.
While not a good criteria, the Evers maps passing the smell test (they look decent to a Wisconsinite who doesn't know about the state's political or population geography) means it's less likely to generate blow back from voters who want fair maps but are worried about Dems taking advantage of their votes
Petering maps are interesting. Republicans have very slight institutional advantage (which is just a fact, I suppose) but seats largely would follow statewide voting trends.
At some point, I’m gonna read all these links and form my own opinions, but my short question right now is has someone done a chart or matrix that compares expected partisanship, as well as other important measures like compactness and breaking of municipal and county lines? So folks can see some side-by-side data comparisons? I’d love to know some quantitative comparisons and be able to see it all in one chart.
Essentially Petering is most Dem-favorable although only in the sense that it best matches 2022 election results. He seems to sacrifice compactness a bit to have the legislature essentially mirror the state as a whole while otherwise following the rules.
I’m so confused as to why we are drawing maps based on votes for either party. I have moved three times since the last time I voted. And I vote for a person not a party. How am I being fairly represented by changing a map?
Wait. Before you jump all over me and give me an answer I that.
What I’m really asking is why are we making maps based on parties? Shouldn’t they be just based on location? Municipalities and counties or natural boundaries?
Partisanship is the last of the criteria set by the Supreme Court. In my opinion in a 50-50 state the resulting maps should be close to that, not favoring either party. Otherwise it’s just another gerrymandered map.
The false narrative pushed by the right in Wisconsin about new maps being drawn to gerrymander in favor of Democrats needs to end today. On every map submitted, per John Johnson's research, Republicans would have won a majority in three Assembly using numbers from the 2022 election.
Legislative Republicans coming back after *all this* with the same degree of absurd gerrymandering in their submitted map is so hilariously on the nose.
I've updated my analysis to reflect a joint stipulation filed by the parties. According to this document, the blocks which make the Senate Democrats plan noncontiguous (according to the US Census Bureau's GIS file) should nonetheless be treated as contiguous for the purposes of evaluation a plan. I'm not yet certain of the reasoning here, but the join stipulation was agreed to by all parties, so I've include it's outcome in the scorecards. Read the stipulation yourself here if that's how you like to spend your Saturday nights. https://www.wicourts.gov/courts/supreme/origact/docs/23ap1399_0102stip.pdf


Here's the WILL maps: https://davesredistricting.org/maps#viewmap::55a849c8-0687-4b89-ab78-b6b3c4e8097b (Assembly) and https://davesredistricting.org/maps#viewmap::26aa9638-8740-4373-8059-a599d48ff2ae (Senate).
Honestly the Senate Democrats and WILL are probably the two best options.
Thank you!
How could WILL be a good option? They rig court cases to destroy our civil rights laws. How are they not rigging the maps?
Three above in the OP, the WILL link pinned here in comments, and reader shares the rest:
Republican legislators: https://acefiling.wicourts.gov/document/eFiled/2023AP001399/751962
Wright (the case brought through a secondary challenge, "citizen mathematicians and scientists"):
- Senate: https://davesredistricting.org/maps#viewmap::ce37e27e-c63e-4e1e-84d6-8756f5cefea4
- Assembly: https://davesredistricting.org/maps#viewmap::212e431d-2eb2-4253-b024-fb0d570e4bd4
Matt Petering, PhD (UW-Milwaukee professor, "algorithm" map):
- Senate: https://davesredistricting.org/maps#viewmap::cde7eca5-bab8-4e01-90f5-984ae02793a0
- Assembly: https://davesredistricting.org/maps#viewmap::681929c4-f023-4cb7-9c39-2308758e6997
Here's my analysis of how these 7 plans perform across the criteria laid out in the Court's majority opinion. https://law.marquette.edu/facultyblog/2024/01/analysis-of-proposed-legislative-redistricting-plans-submitted-to-the-wisconsin-supreme-court/
Feel free to dig into the code and additional metrics contained in this repo: https://github.com/jdjohn215/wi-legis-map-proposals-2024/tree/main
These maps are about 50-50. Most curious about what incumbent Rs would be displaced. Looks like Jessie Rodriguez would lose her seat.
For "these maps," you're referring to the Law Forward submission, yes?
(Also, quick comment Shawn!)
Yes those ones
Everyone should be following John Johnson from Marquette University, who has already laid the groundwork for some terrific analysis of the various maps submissions.
See his work here: https://github.com/jdjohn215/wi-legis-map-proposals-2024
Follow him on Twitter here: https://x.com/jdjmke
Here’s Johnson’s updated analysis: https://law.marquette.edu/facultyblog/2024/01/analysis-of-proposed-legislative-redistricting-plans-submitted-to-the-wisconsin-supreme-court/
A few more good summaries/reactions to the new maps:
-WPR Summary of each submission: https://www.wpr.org/news/most-map-proposals-before-wisconsin-supreme-court-would-dilute-gop-legislative-majorities
-Dr. Sam Wang (Princeton Gerrymandering Project): https://twitter.com/SamWangPhD/status/1746315504329912778
--He was also interviewed by on UpNorth News Radio about the submissions on January 16th: https://civicmedia.us/shows/upnorthnews
For reference, here are my in-depth previews of the 2022 state legislative elections in the...
Assembly: https://www.therecombobulationarea.news/p/wisconsin-state-assembly-election-preview-2022
Senate: https://www.therecombobulationarea.news/p/2022-state-legislature-wisconsin-preview-senate
So we’re going to have seven total submissions to look through, per the MJS.
From “ Democratic Gov. Tony Evers, Republican legislative leaders, Democratic lawmakers, University of Wisconsin-Milwaukee professors, the conservative Wisconsin Institute for Law & Liberty and the petitioners who brought the lawsuit who are represented by Law Forward, a liberal legal firm.”
https://www.jsonline.com/story/news/politics/elections/2024/01/12/wisconsin-gerrymandering-case-attracts-7-sets-of-proposed-new-maps/72195598007/
Milwaukee Journal Sentinel use an oxford comma challenge. Also list more than six things when you promise seven challenge.
Many challenges.
The Democratic proposals are probably good on partisanship (if not a little too good) and are horrible on just about everything else. The districts are not compact and have minimal care for municipal or county boundaries. Most people who aren't partisan Dems, if they see the proposed maps, won't see them as good and instead see a map that Dem politicians drew for their own benefit
One thing that's disappointing about the Clarke and Evers maps is they didn't change the VRA districts in Milwaukee, keeping the same districts that the GOP passed 2 years ago. While not terrible, the GOP did relegate one Black district to an opportunity seat (which was won by Darrin Madison, who is Black)
I sort of get it though. The Evers proposal was originally struck down for VRA reasons (when they expanded to 8 Black districts, but made each only barely majority Black). Keeping the same districts means SCOTUS can't use them as a reason to overturn the maps (since they were fine with them before)
Overall, I think my favorite is the Evers proposal, which balances well the desires for fair partisanship, compact districts, and municipal integrity.
While not a good criteria, the Evers maps passing the smell test (they look decent to a Wisconsinite who doesn't know about the state's political or population geography) means it's less likely to generate blow back from voters who want fair maps but are worried about Dems taking advantage of their votes
Yeah, the Law Forward maps are definitely the best. Biden won in 2020. The majority of districts in both chambers should be Biden districts.
Personally, from what I see:
Clarke > Tony Evers > Dem State Senators
Haven't seen the others, though I'd imagine the Republicans plan would go in last place for me lol
Petering maps are interesting. Republicans have very slight institutional advantage (which is just a fact, I suppose) but seats largely would follow statewide voting trends.
At some point, I’m gonna read all these links and form my own opinions, but my short question right now is has someone done a chart or matrix that compares expected partisanship, as well as other important measures like compactness and breaking of municipal and county lines? So folks can see some side-by-side data comparisons? I’d love to know some quantitative comparisons and be able to see it all in one chart.
John Johnson just seems to have published his: https://github.com/jdjohn215/wi-legis-map-proposals-2024
Essentially Petering is most Dem-favorable although only in the sense that it best matches 2022 election results. He seems to sacrifice compactness a bit to have the legislature essentially mirror the state as a whole while otherwise following the rules.
I’m so confused as to why we are drawing maps based on votes for either party. I have moved three times since the last time I voted. And I vote for a person not a party. How am I being fairly represented by changing a map?
Wait. Before you jump all over me and give me an answer I that.
What I’m really asking is why are we making maps based on parties? Shouldn’t they be just based on location? Municipalities and counties or natural boundaries?
Partisanship is the last of the criteria set by the Supreme Court. In my opinion in a 50-50 state the resulting maps should be close to that, not favoring either party. Otherwise it’s just another gerrymandered map.
The false narrative pushed by the right in Wisconsin about new maps being drawn to gerrymander in favor of Democrats needs to end today. On every map submitted, per John Johnson's research, Republicans would have won a majority in three Assembly using numbers from the 2022 election.
Legislative Republicans coming back after *all this* with the same degree of absurd gerrymandering in their submitted map is so hilariously on the nose.
I've updated my analysis to reflect a joint stipulation filed by the parties. According to this document, the blocks which make the Senate Democrats plan noncontiguous (according to the US Census Bureau's GIS file) should nonetheless be treated as contiguous for the purposes of evaluation a plan. I'm not yet certain of the reasoning here, but the join stipulation was agreed to by all parties, so I've include it's outcome in the scorecards. Read the stipulation yourself here if that's how you like to spend your Saturday nights. https://www.wicourts.gov/courts/supreme/origact/docs/23ap1399_0102stip.pdf
Honestly from a central WI perspective my top 2 are Petering and Every, they make sense in terms of compactness and distribution.